

The leading causes of death by age group on four continents: 4 charts
The U.S., Australia, Europe and South America have different mortality stories. Learning about them may help you change yours.

Author’s request: If you like this post, please “like” this post! It really helps the algo.
What’s your mortality story?
One thing I’ve learned from AGING with STRENGTH is that the simple act of learning more about a subject, like eating and cooking healthier or drinking less, makes doing something about it much more likely.
In that spirit, below I’ve compiled four charts — three through original data reporting — that show the most common causes of death, by age group (45 and older), for people in the United States, Australia, Europe and South America. Some of these mortality pathways may be familiar to you. Seeing how they change across age groups and cultures, however, is illuminating.
Why you should think about how you might die
The more we contemplate what is, statistically, most likely to kill us, the greater our chances of avoiding it and instead leaving this world on our own terms.
I’ll give you a very personal example: My very healthy dad had no business dying, at 74, after slipping on some ice and hitting his head in a restaurant parking lot on a bitter-cold suburban Chicago January evening. But because he died in that manner, leaving a good 10 to 15 years on the table, the bell in my own head now sounds far more frequently when I’m tempted to take ill-advised physical risks. Mortality mindfulness, I believe, breeds healthy longevity.
At the bottom of this post, I offer some suggestions on how to influence your mortality story away from the statistical Top 10.
Here’s what the age-group mortality charts reveal
The charts below show what my physician friends refer to as “a shit-ton of heart disease” (doctors curse, sometimes) which is caused by several factors:
Industrialized food made in factories by companies motivated only by profit are killing people in slow motion1. Eating packaged pastas, high-sugar breads, high-fat processed cheese and frozen pizzas for 30+ years, washed down by daily “fridge cigarettes” (aka Diet Coke), will likely cause you to die much earlier than nature intended.
Sedentary lifestyle choices — sitting in front of screens and taking the majority of one’s calories from foods high in trans fats, saturated fats, sodium and added sugars — cause excess weight gain that increases the risk of high blood pressure, diabetes and other cardiovascular risk factors.
Chronic stress from work and financial worries and disconnected, digital-first lifestyles contribute to hypertension and other heart disease risk factors. Stress also make it harder to take advantage of the single greatest (and completely free) longevity drug in the universe: sleep.
Social and economic factors matter, too. Food deserts in urban and rural areas foster dependency on corporation-owned, industrialized deathfoods that taste addictively good, are often marketed as healthy and are almost always less expensive than healthy, whole foods.
Environmental factors like air pollution also play a bigger role in dementia than we have previously understood.
The combination of these factors, along with longer lifespans that allow more time for cardiovascular disease to develop, helps explain why these regions see such high rates of heart disease compared to areas where traditional diets and more active lifestyles remain common.
So, let’s get to those death charts! First, some caveats to consider:
None of it is broken out by gender (sorry).
The age groups are not consistent across the 4 continents, owing to differences in how governments report data. In Europe, for instance, ages are divided only above and below 65.
The charts showing mortality risk for the U.S. comes directly from the American Centers for Disease Control and Prevention. The charts for Australia, Europe and South America are original data visualizations based on government data sources synthesized by Anthropic’s AI application, Claude, and vetted by a human — me. A more detailed explanation appears above the Australia chart.
The United States: leading causes of death
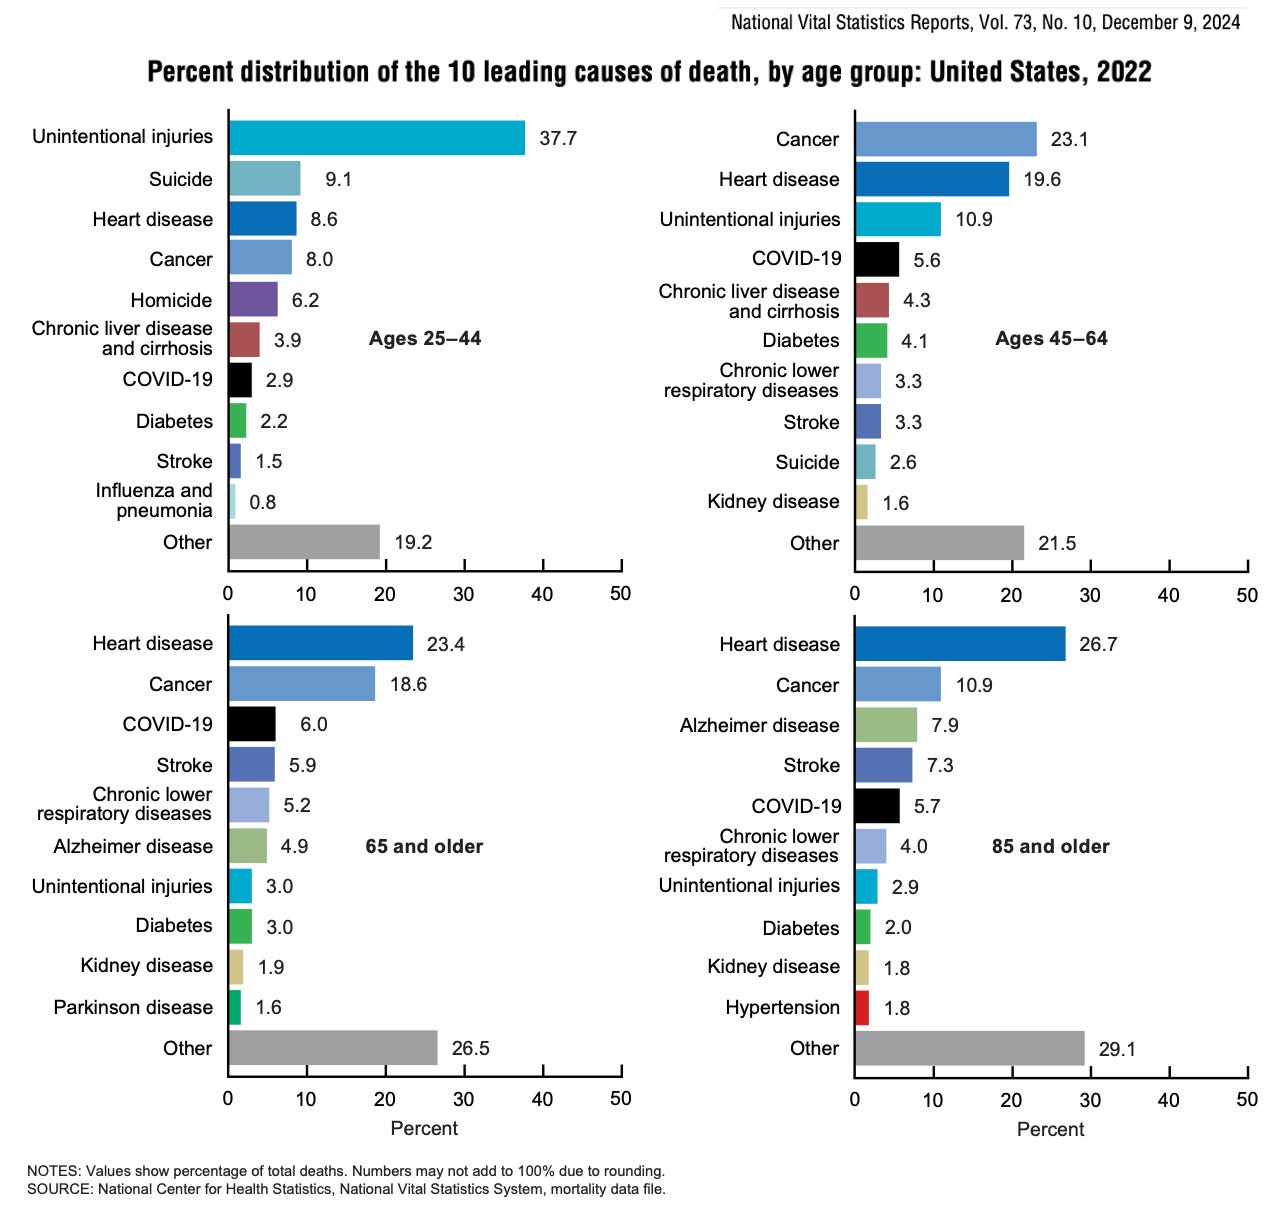
What does the U.S. data show?
Cancer dominates middle age — 23.1% of deaths among people 45 to 64, but then steadily declines to just 10.9% in people 85 years and older
Heart disease grows with age — from 19.6% (45 to 64) to 23.4% (65 and older) to 26.7% (85 years and older), becoming the clear leading killer in advanced age
Alzheimer's emerges dramatically — it doesn't appear in younger groups but becomes 7.9% of deaths in ages 85+, showing age-specific neurodegeneration
There’s a clear mortality transition from preventable (ie, external) causes in middle age to chronic disease dominance in advanced age
The emergence of competing risks: As Americans survive cancer and heart disease longer, neurological conditions like Alzheimer's become more prominent
The vast “Other” category, along with “Unintentional injuries” are explained in this footnote2
What about Canada?
The broad mortality patterns are remarkably similar between Canada and the U.S. The main differences are in magnitude rather than pattern. For instance, Canada has:
Slightly lower overall mortality rates
Higher life expectancy. The U.S. still lags behind most other developed countries in life expectancy. (Canada's life expectancy in 2023 was 81.7 years — 79.5 for men; 83.9 for women — compared to 78.4 years overall life expectancy in the U.S., with 75.8 years for U.S. men and 81.1 years for U.S. women)
Comparable chronic disease burden
Australia, Europe & South America leading causes of death
The three charts that follow provide a clearer portrait of how the leading causes of death by age group in Australia, Europe and South America compare and contrast with those in the United States.
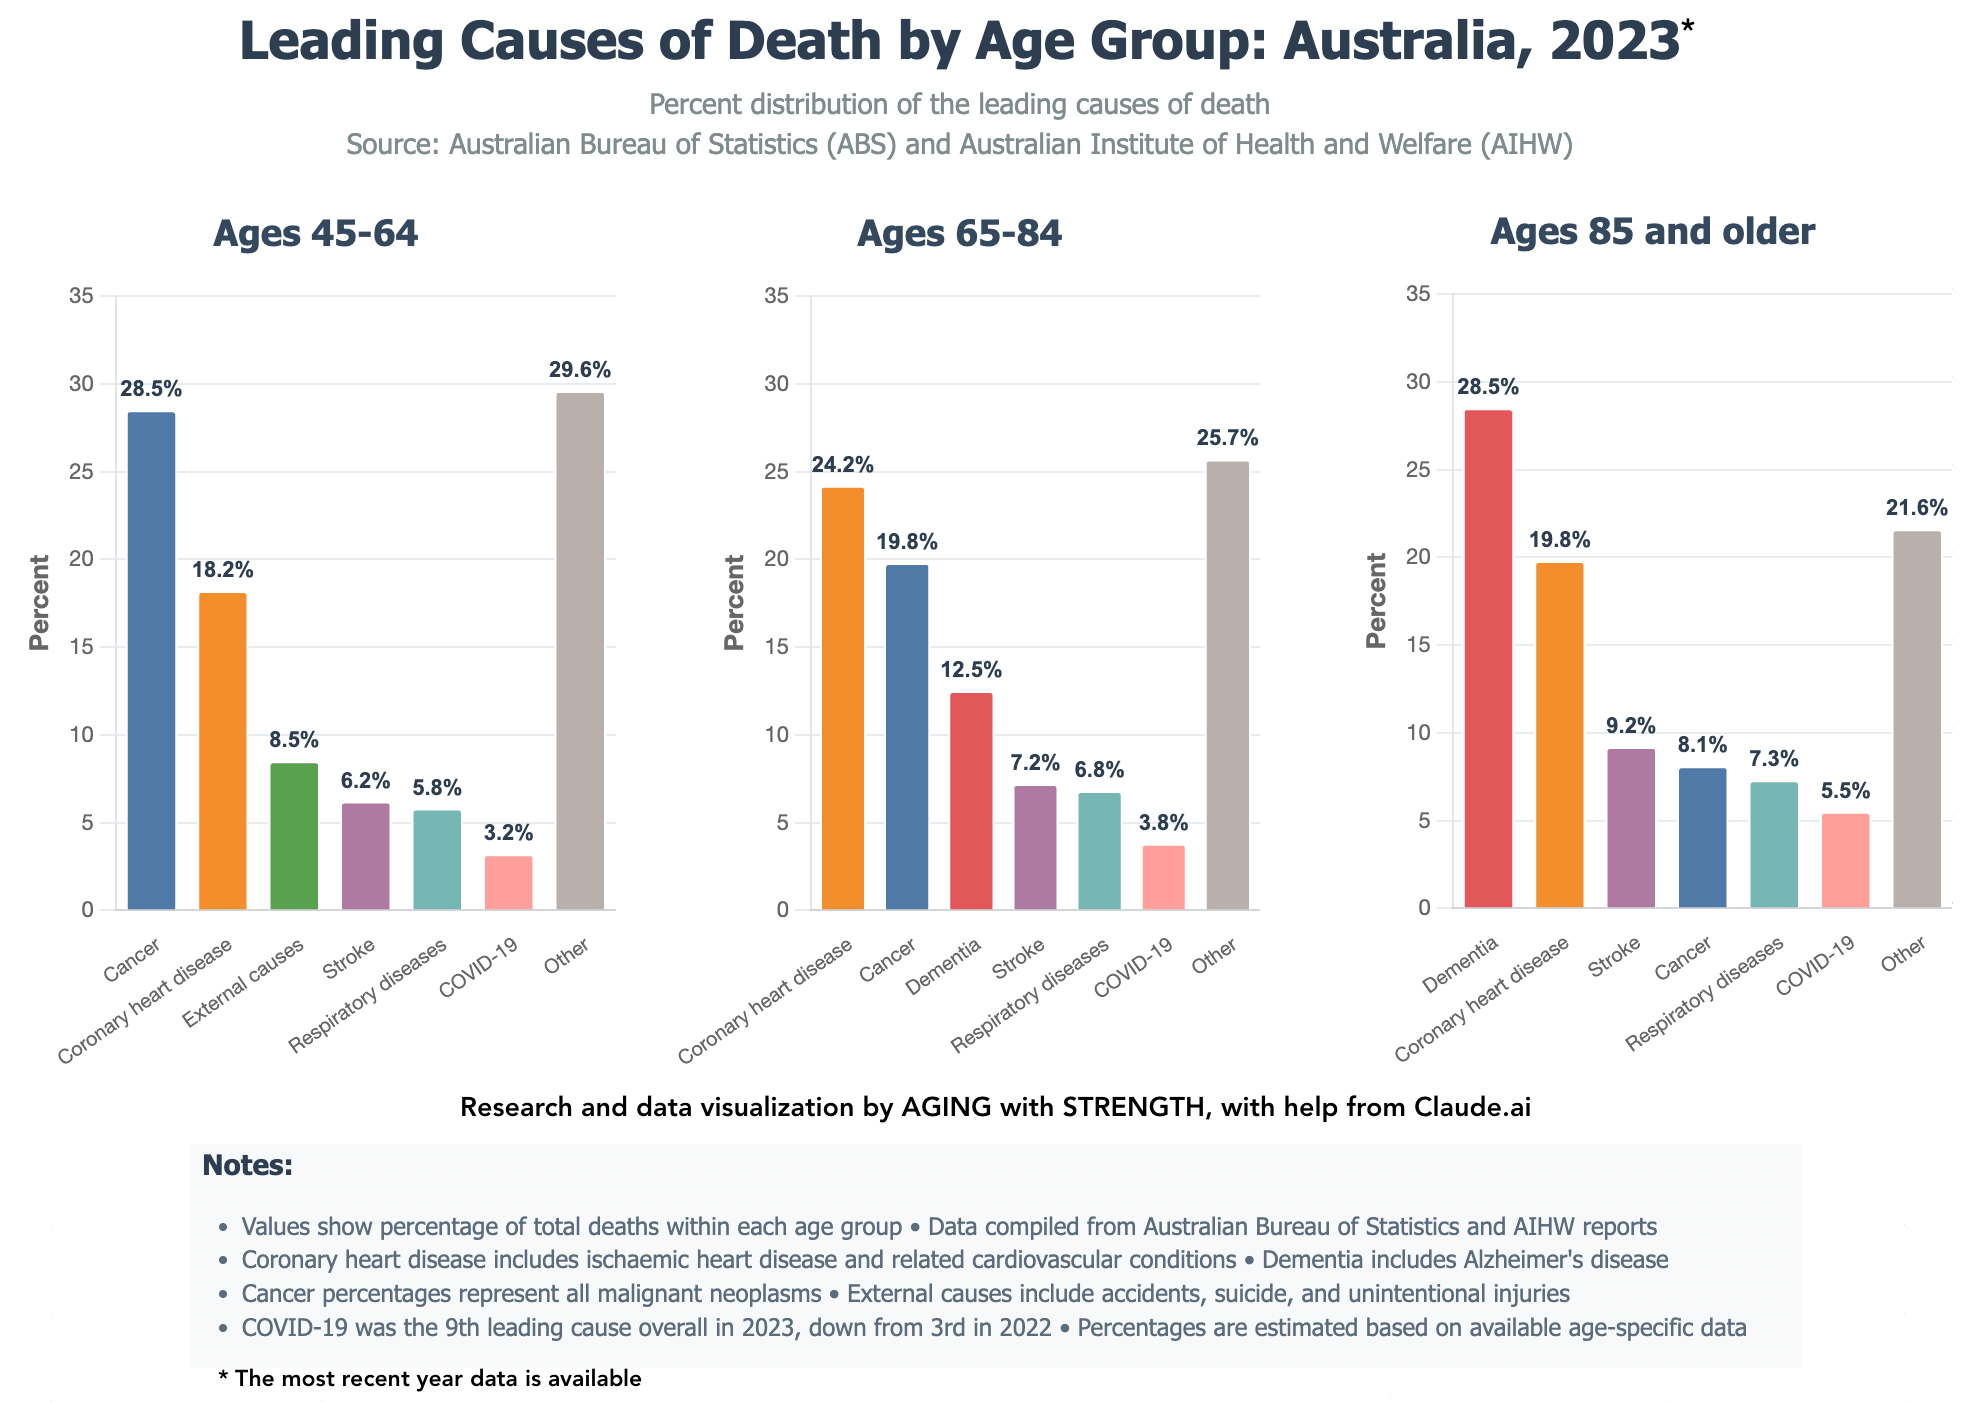
1 | Australia: leading causes of death by age group
Australia(which resembles New Zealand’s mortality risk, generally) shows a similar epidemiological transition to the U.S.: cancer dominates middle age and heart disease increases with advanced age, but with notable differences in dementia prominence (due to more poeple living longer but also perhaps partially due to changes in how deaths are reported) and external cause rates that reflect Australia's unique healthcare system and population health profile.
These three graphics are AI-assisted data visualizations, based on official government sources, of underlying patterns of mortality causes. The specific percentages shown are analytical estimates, not direct official statistics. Read the charts for the patterns they reveal more than any specific percentage.
A note about the “External causes” category
"External causes" is standard medical vernacular to distinguish deaths from outside causes from causes, like diseases, that originate within the body. In the charts below, the category includes deaths from injuries and violence, specifically accidents and unintentional injuries (car crashes, falls, drowning, poisoning); homicide (including gun violence); suicide; and workplace accidents.
This post is free, without any paywall. If you find it useful to you, please consider supporting AGING with STRENGTH with a paid membership….
…or make a one-time contribution. It really does make a difference!
You’ll see how prevalent external causes are in the South America chart below.
What does the Australia data show relative to the U.S.?
Dementia emerges much earlier and more prominently in Australia3, becoming the leading cause at 85 years and older (28.5%) compared to appearing later and less dominantly in U.S. data. Australia's dramatic dementia death increase may be mostly due to changed reporting practices, not a disease epidemic. (Doctors more often list dementia as the underlying cause nowadays, instead of immediate complications like pneumonia.)
External causes are significantly lower. Australia's lower rate (8.5%) compared to the U.S. (11.9%) likely reflects stronger safety regulations, gun restrictions, workplace safety standards and injury prevention programs.
Cancer patterns are similar between countries in the 45 to 64 age group (28.5% in Australia vs 23.1% in the U.S.), showing similar cancer burden in middle age.
Heart disease dominance in older age is comparable but slightly higher in Australia's 65 to 84 age group (24.2% vs 19.6% in Americans 45 to 64), reflecting successful survival to older ages.
2 | Europe: leading causes of death by age group
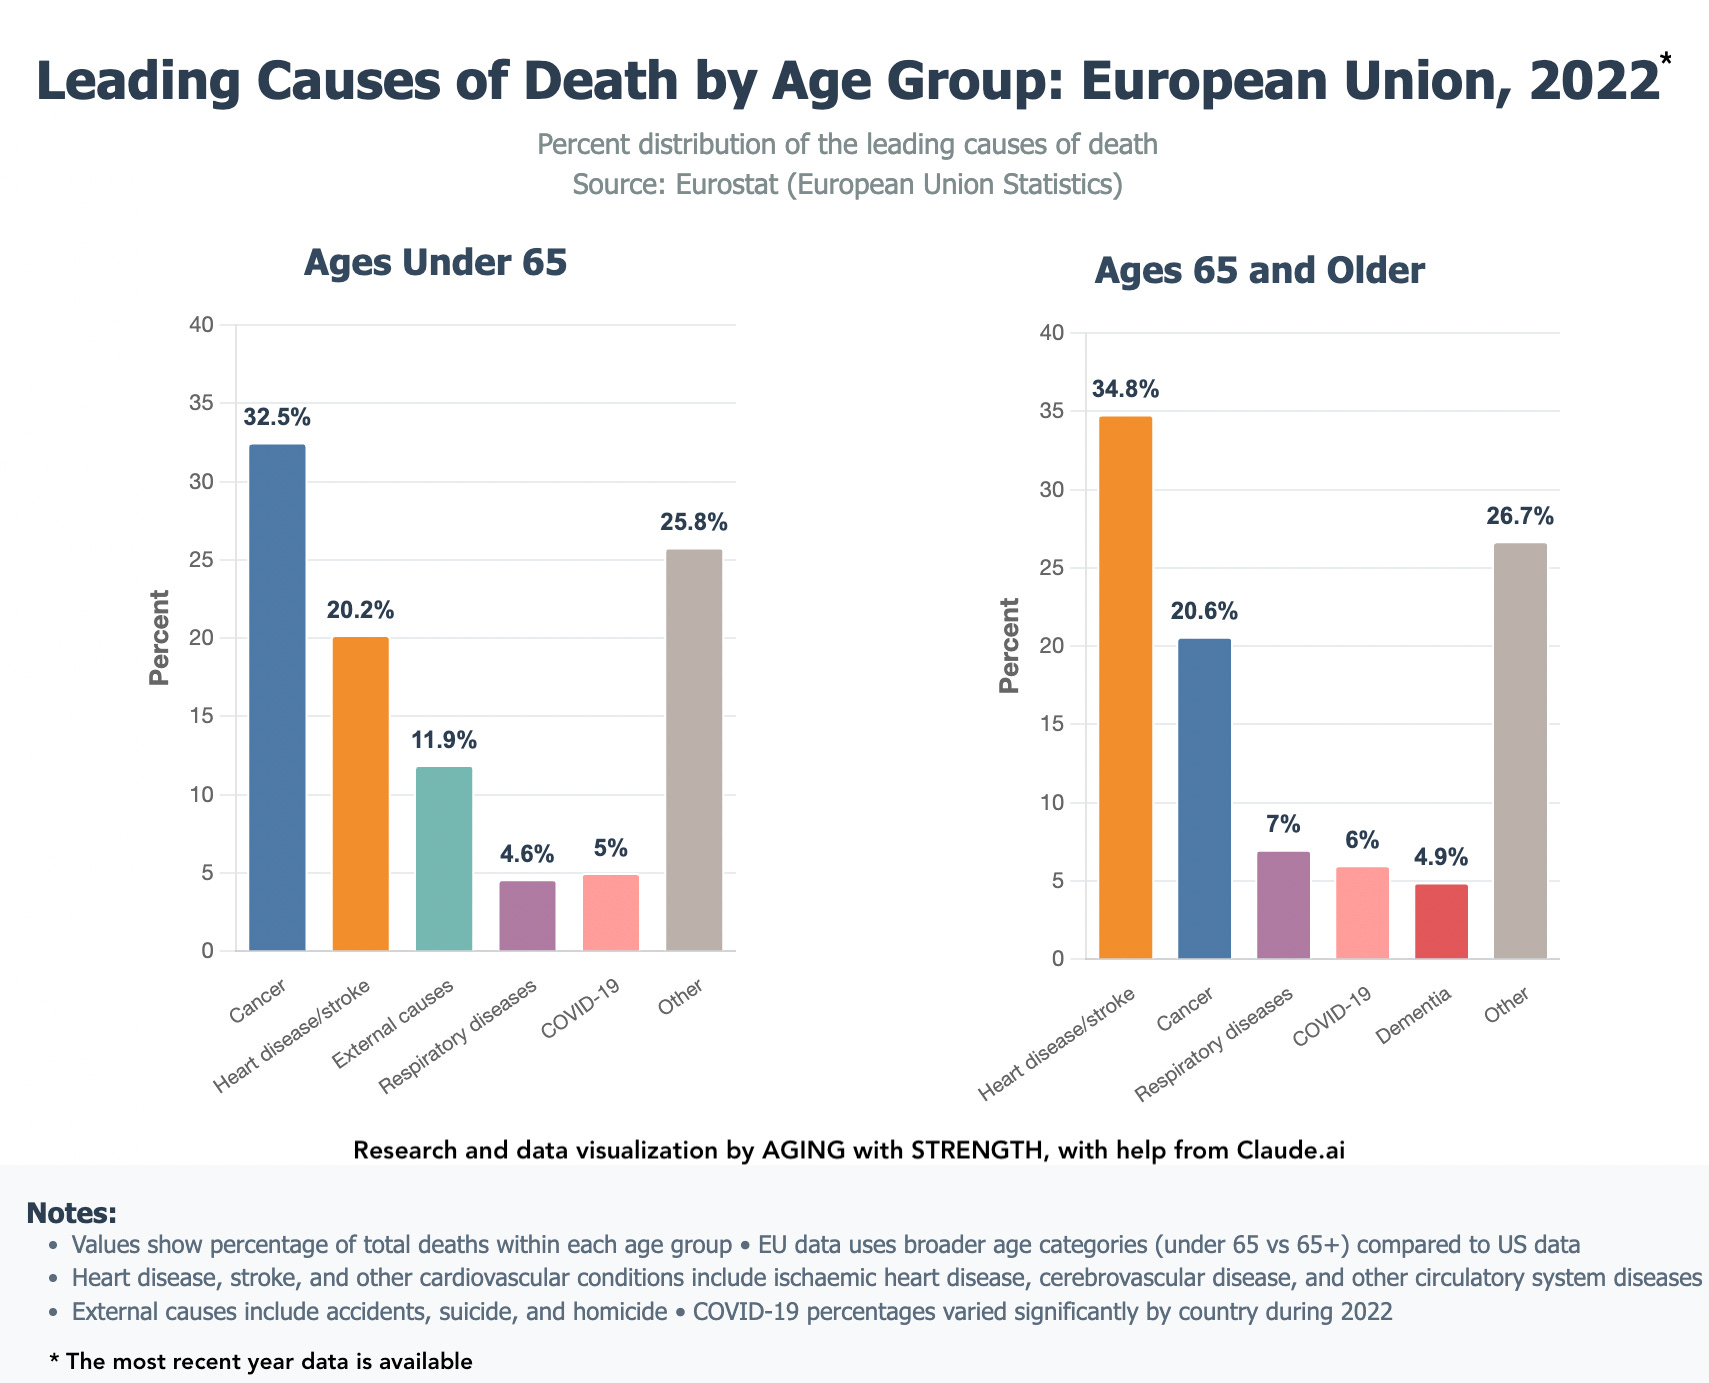
What does the Europe data show relative to the U.S.?
• Heart disease dominance is much greater in Europe — 34.8% among Europeans aged 65 or older, compared to 26.7% of Americans 85 years or older, suggesting Europeans either have higher cardiovascular disease rates or less successful treatment allowing survival to very old age
• Cancer patterns are remarkably similar — 32.5% (under 65) in the E.U. vs 23.1% (45 to 64) in the U.S., showing the global burden of cancer in middle age, though E.U. rates appear higher
• Europe lacks the dramatic Alzheimer's emergence — Only 4.9% for people 65 years or older vs 7.9% for Americans 85 years and older, either reflecting different diagnostic practices, reporting methods or actual disease patterns
• External causes are, surprisingly, higher in Europe — 11.9% of Europeans under 65 vs 10.9% of Americans 45 to 64. This data contradicts common assumptions about European safety vis-à-vis the U.S. That may be due, as I suspect, to the misaligned age-group definitions (Europe's "under 65" includes younger, higher-risk ages than the U.S.’s "45-64" bracket), different reporting practices or actual differences in injury patterns that don't align with stereotypes about European safety systems.
Helpful post? Consider a one-time contribution to AGING with STRENGTH.
Europe shows a much simpler mortality pattern — heart disease and cancer dominate across age groups without the complex transitions (like dementia emergence) seen in U.S. and Australian data. That may be the result of different healthcare approaches, reporting practices…or the limitations of having only two broad age categories rather than more granular breakdowns.
Here’s a link to E.U. causes of death, broken down by gender.
3 | South America: leading causes of death by age group
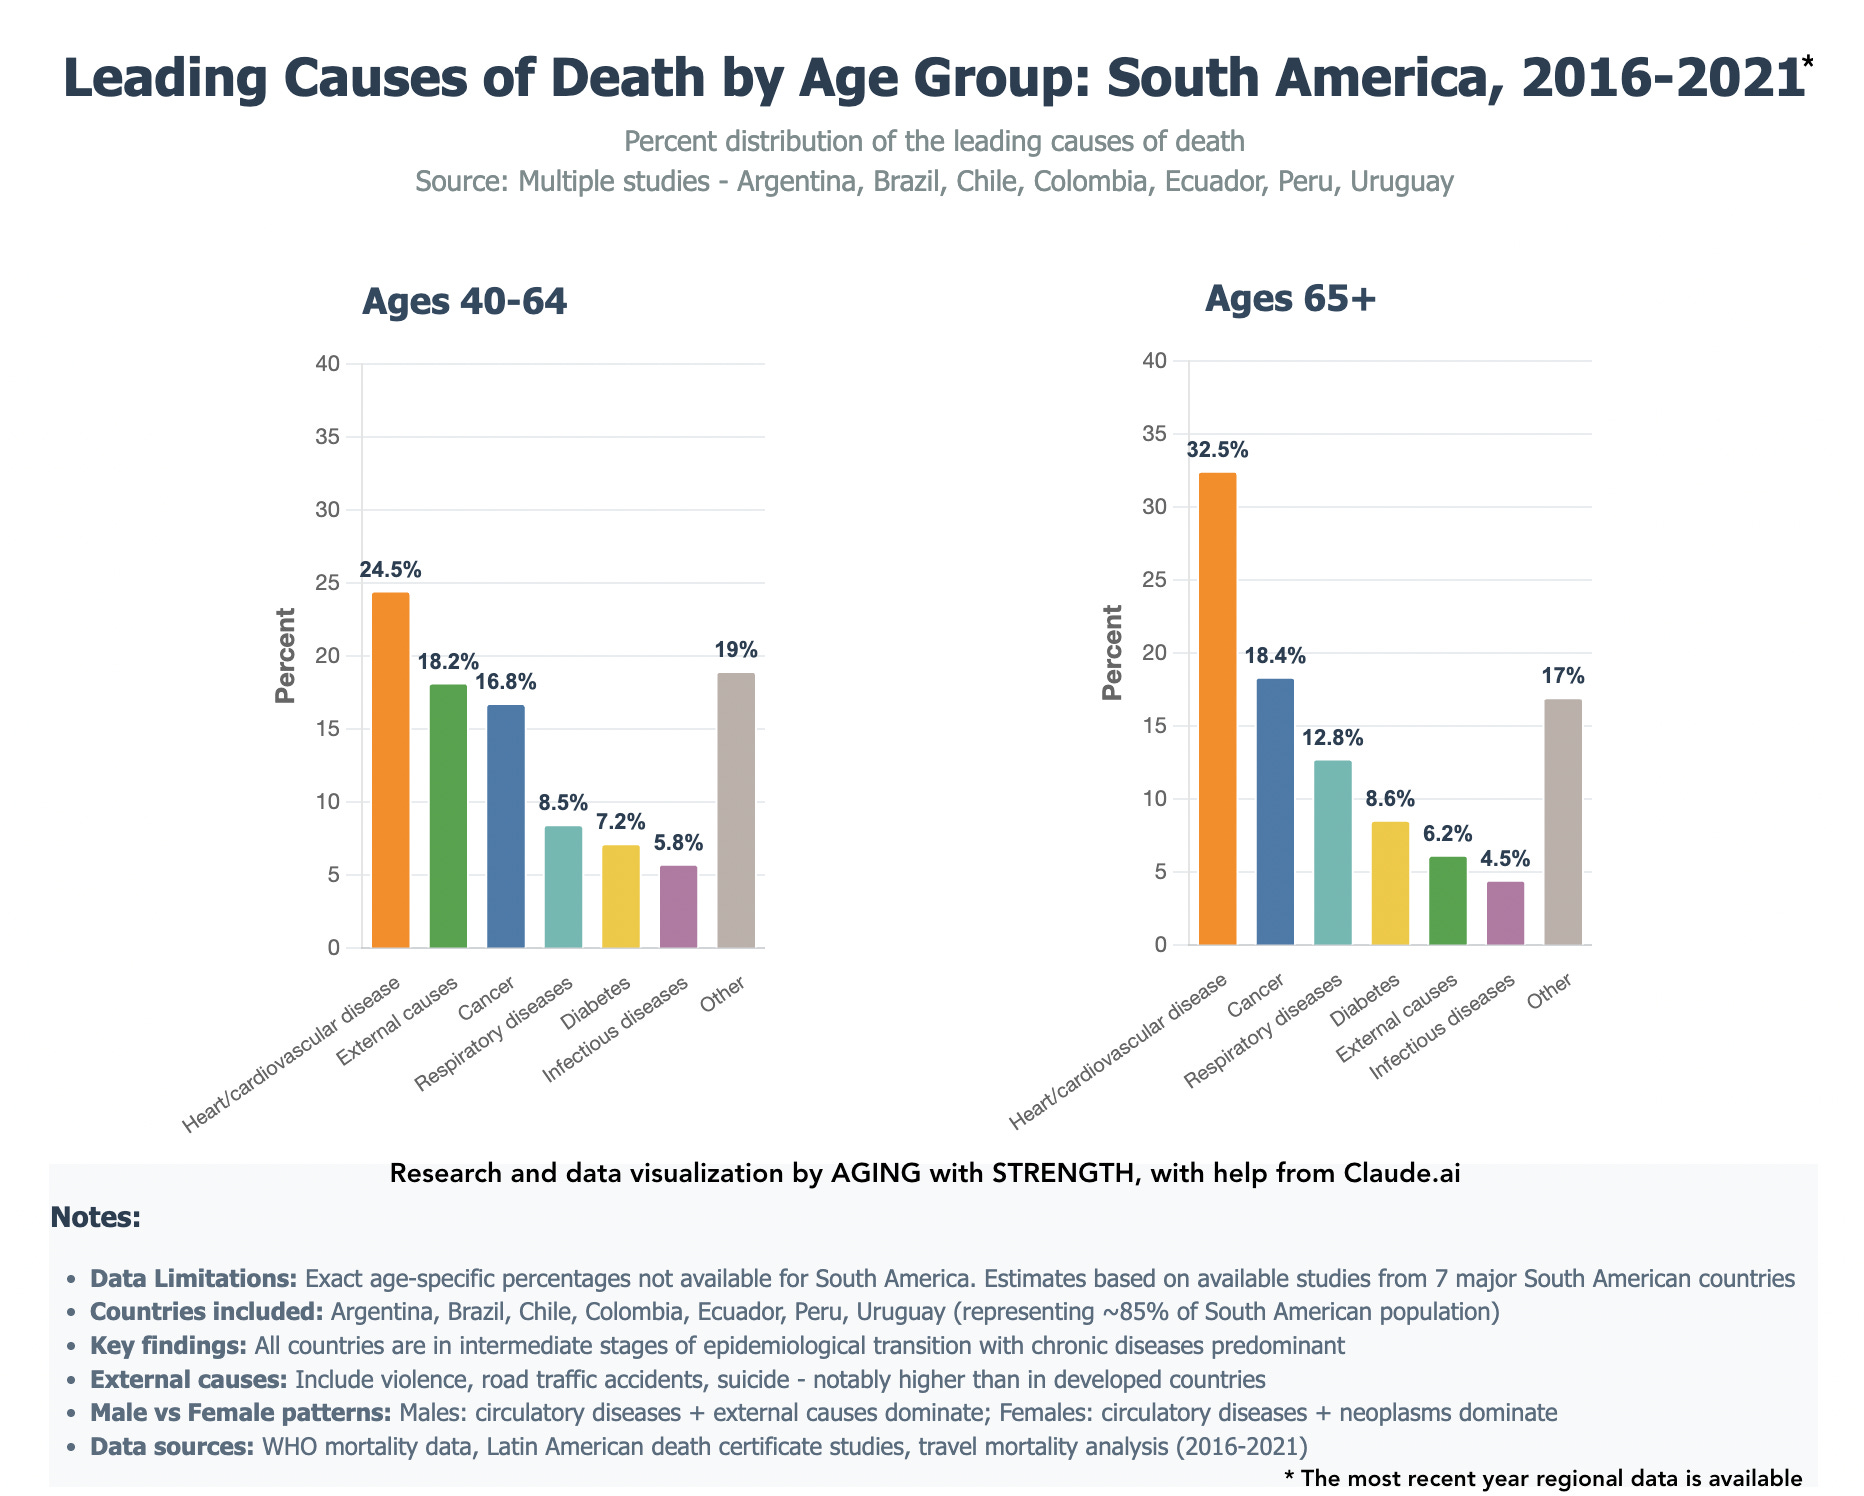
South America's mortality patterns are quite interesting, not entirely for good reasons. External causes are the second leading cause of death among people 40 to 64 years old — higher than cancer. The data seem to reflect a society in transition between infectious disease burdens often seen in developing nations and chronic disease patterns common to developed countries.
What does the South America data show relative to the U.S.?
External causes are dramatically higher — 18.2% of South Americans 40 to 64 vs 10.9% of Americans 45 to 64, likely a result of South America's ongoing struggles with violence, road traffic accidents and workplace injuries
Heart disease peaks earlier and higher — 32.5% of people 65 or older vs 26.7% of Americans 85 years or older, suggesting either more aggressive cardiovascular disease or less successful long-term management allowing survival to advanced age
Cancer burden is lower — 16.8% of people 40 to 64 vs 23.1% of Americans 45 to 64, possibly due to different lifestyle factors, environmental exposures or healthcare access affecting cancer detection and outcomes
Infectious diseases persist — 5.8% of people 40 to 64 perish from infectious diseases, a mortality category absent in the U.S. data
Diabetes appears more prominent — likely reflecting dietary transitions, obesity trends and healthcare access issues in the region
How to use all this mortality data
View it as a roadmap for targeted prevention at different life stages. As the charts show, the biggest threats change, sometimes dramatically, with age. Many of these leading causes of death are preventable through lifestyle choices and early interventions.
Actionable insights to consider
First, stop making deathfoods the basis for your daily calories. I did. In a few months, I went from regularly eating steak, boxed cereal and industrialized lunch meats, cheeses and breads — and Cheetos! — and drinking a whiskey a night to eating only whole foods, a salad a day, learning how to cook and plan meals around plant-based protein (peas, chickpeas, lentils, chia seeds, walnuts, etc.), cutting out daily drinking and never buying chips….except in emergency situations.
Think about prevention by age. Cancer screening and avoiding major injury in middle age (45 to 64), cardiovascular health in older age (65 years or older), and cognitive health in advanced age (85 years and up).
Start your cardiovascular prevention early. Since heart disease becomes the dominant killer with age across all these cultures, start thinking about blood pressure management, cholesterol control and regular exercise in early middle age….or now! It’s never too late to start becoming healthier.
Don't ignore “external causes.” Unintentional injuries are major killers in the roughly 45 to 64 age group; prioritize safe driving, workplace safety, home safety modifications and supporting your mental health.
Care for your brain and cognitive health. The rise of dementia in the oldest age groups (especially in Australia) suggests maintaining cognitive function is a huge priority. (More on dementia’s correlation to pollution in the next post.)
Prevention compounds over time. Early intervention in midlife prevents multiple later-life conditions, as surviving one major cause often leads to death from another.
There’s a lot of data in this post. Don’t worry about juggling too much of it. The point, as I wrote at the top, is to start thinking about these big mortality risks so that they become more common to your thinking and, hopefully as a result, less likely to afflict you.
I hope this data is useful to you, either as a whole or in small bit. Please leave a comment and let me know what you think.
Ultra-processed foods comprise the majority (55%) of calories consumed by American adults. How long until UPFs account for 2/3 of Americans’ energy from food?
Unintentional injuries typically comprise car accidents (car crashes, motorcycle accidents, pedestrian fatalities, etc.), which are very typically the largest component of this category. It also includes falls — particularly significant in older adults cohorts, but also includes falls from heights, down stairs, etc.; poisoning, including drug overdoses (both prescription and illicit drugs), carbon monoxide poisoning, and other toxic exposures; drowning; fires and burns; suffocation and choking; and other accidents like workplace injuries, sports-related deaths, firearm accidents, etc.
The "Other" category, which is indeed large, would likely encompass hundreds of different causes of death that individually don't rank in the top 10, such as infectious diseases, rare cancers, congenital conditions, complications from medical procedures, other types of accidents and injuries and numerous other medical conditions that cause death.
(Thanks to reader Randy O. for pointing out the need to explain these two categories!)
Women accounted for a full two-thirds of Australians who died from dementia in 2023, and dementia remains the leading cause of death among women, which the government health bureau has attributed to their greater life expectancy.
Interesting article. Thank you. One of my big takeaways is that as an American over 45, there’s not much chance I’ll be murdered. I like that.
Yikes, I think I'll console myself with some dark chocolate (epicatechin for the win!).